

Free rides: CTS usage up 11.5%
 Write a letter to the editor
 More frequent service, better on-time performance, and free rides for Wahoos. The head of Charlottesville Transit Service says these are three factors that led CTS to a ridership spike of 11.5 percent from this time last year and to log its one-millionth passenger of the fiscal year with five months to go.
“I feel encouraged,” says CTS transit manager Bill Watterson. “We’re demonstrating that we can make ourselves work better.”
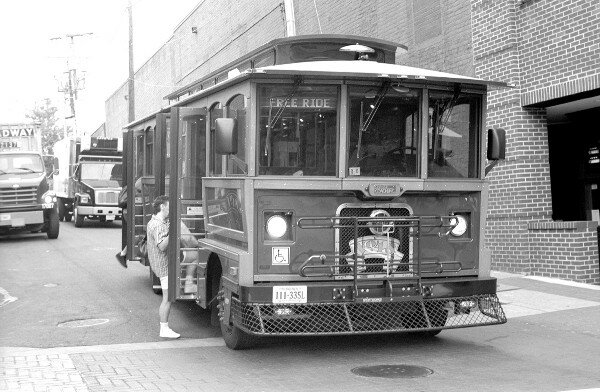
At our request, Watterson provided the Hook with route-by-route ridership figures that show that 69 percent of the rides occur on just two of CTS’s 18 routes: the Free Trolley, which connects UVA and downtown, and the #7 bus, which links downtown to Fashion Square Mall, passing such hotspots as the Corner, Barracks Road, and K-Mart/Seminole Square.
“Those two routes,” explains Watterson (no relation to the famous cartoonist), “provide service every 15 minutes, which is bigger than everywhere else we do.”
The system has come under fire for allegedly sparse coverage and long intervals between buses, but Watterson notes expanded Sunday service, and he points out that Albemarle County funded extra buses for Route #5 this year, bringing that schedule to 30-minute intervals— up from last year’s hour-long gap between buses connecting Barracks Road Shopping Center and Wal-Mart.
CTS recently opened a new $6.5 million transit center, and some City and County leaders have expressed interest in creating a $100 million+ regional transit system as a successor to CTS to serve a larger geographic area. In the meantime, here’s the list of routes, their total numbers of riders, and their destinations:
Free Trolley 326,264 UVA
Route 1A 11,049 Woolen Mills
Route 1B 10,507 PVCC
Route 2A 10,788 Old Martha Jeff
Route 2B 10,448 Fifth St. Extd.
Route 3A 25,629 Belmont
Route 3B 15,107 Greenleaf
Route 4A 29,679 Cherry Ave.
Route 4B 28,435 Fry’s Spring
Route 5 71,959 Wal-Mart to Barracks Road
Route 6A 23,483 Ridge Street
Route 6B 16,554 K-Mart
Route 7 343,910 Fashion Square
Route 10 34,366 New Martha Jefferson
Route 21 4,665 Belmont (night)
Route 22 7,361 Prospect (night)
Route 23 1,286 PVCC (night)
Route 24 3,908 Pantops (night)
Other 17,075
TOTAL 992,473
–All routes originate Downtown unless otherwise noted.
#
Has the transit center increased ridership? What are the numbers for the new Sunday service? How were these numbers determined, actual count or extrapolation? Do they include those riders who are fare free?
I’m also curious about how the numbers were determined.
Were there more home games for UVA football from one year to the next? What was the temperature differential in the years, and how does that affect ridership? What happened the following month when fares were once again put in to place - did ridership plummet? Were 11% more buses running in the most recent year, or was it the same number of buses?
I heard this blog has 26% more readers than last week due to stories on the bus system :)
After an operation this summer kept me from driving, the bus was a godsend. Except that, while students may use the city service, University folks without an ID (there are many of us, from adjunct faculty to employees of unrelated on-grounds research institutes) can’t use the University buses to get to work, and city buses don’t cover the campus. I had a mile walk, a welcome stroll under most circumstances but not while unstable following back surgery.
Reciprocity, please!
Free rides and more frequent wahoo usage seems to be the biggest reasons for increase. Does increase in population have any bearing on this? By “free” does that mean no one pays for the bus to run? Did anyone expect ridership to decline with free rides?
Let’s see….Damn that bus is free, lets what for the Greyhound I want to pay for my ride! lol
I can’t say $100,000,000 would be well spent unless the population is going to quadruple in the the next 20 years.
I would like to see someone smarter than me figure out how much they spend per year and divide it by the number of riders to determine the TRUE cost of each trip. I suppose there is also a way to determine the average trip length and thus give us the actual cost per mile per rider. I think that that would tell us how much bang we are getting for our buck
One piece of advice to any transit people out there. Increase the busses on rainydays and diminish it on wonderful days to help and also encourage walking
Walking? You think I am going to walk from the downtown mall to the Fashion Square Mall? With so many people getting run over in crosswalks I’m not even sure I would walk from the east end of the downtown mall to the University Corner area.
Lawny - Reciprocity is in place, and has been since shortly before the UVA fare-free agreement was reached. Anyone can use the University Transit System (UTS), including those with no affiliation to the University. There may be a few old bus stop signs sprinkled around saying an ID is required, but I just called UTS to verify that anyone can board.
Mr. Watterson emailed me some “apples-to-apples” comparative numbers this morning. You’ll notice here that there’s no A vs. B breakdown because CTS did not track ridership in such a detailed manner until the current fiscal year.
Route (Jul’06-Jan’07) (Jul’07-Jan’08)
Free Trolley 323,876 326,264
Route 1 15,614 21,556
Route 2 27,727 21,236
Route 3 38,620 40,736
Route 4 55,542 58,114
Route 5 61,480 71,959
Route 6 44,768 40,037
Route 7 263,700 343,910
Route 10 27,113 34,366
Route 21 4,929 4,665
Route 22 7,096 7,361
Route 23 2,815 1,286
Route 24 2,352 3,908
Other 13,205 17,075
TOTAL 888,837 992,473
All of these figures are probably made up in order to get public support for a regional transit authority and streetcars. These decisions are being made behind the scenes. See who the players are :http://www.charlottesville.org/Index.aspx?page=1888